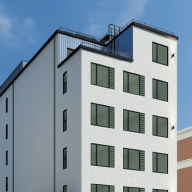
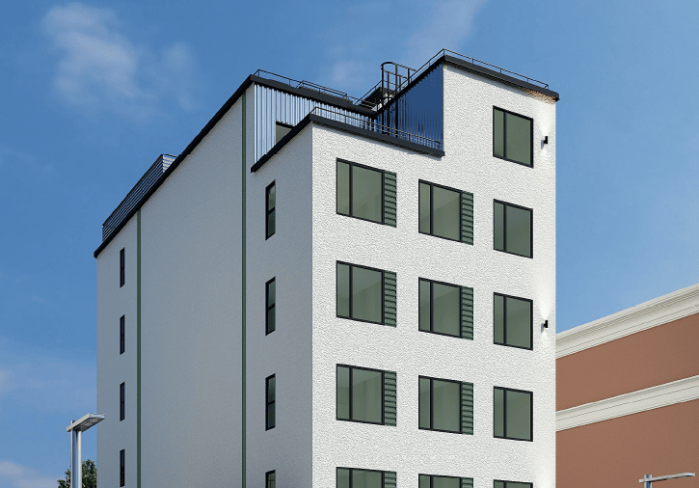
On Tuesday, November 10, Community Board 3 okayed a nine-story residential development planned for Claremont Parkway. To be managed by the non-profit Lantern Organization, the 104-unit development will house low-income families and single homeless veterans, CB3 district manager John Dudley said.
CB3 land-use chair Bruce Rivera was “ecstatic” to see the development win CB3’s blessing the day before Veterans Day. Although neighbors expressed concern about an influx of homeless vets, which some regard as an unstable population, and although the Lantern Organization originally proposed to house foster care graduates rather than low-income families, Rivera is proud that CB3 welcomes “all kinds of folks.”
Indeed, a report released by Borough President Ruben Diaz Jr. lists CB3 – Claremont and Morrisania – as host to more special needs housing developments than most other neighborhoods. CB3 is host to 15 homeless housing developments, more than any other neighborhood.
Chalk it up to CB3’s sense of charity and brotherhood. Or chalk it up to the neighborhood’s poverty. Diaz Jr.’s report reveals that some kinds of special needs housing developments are concentrated in poor neighborhoods in the south and west Bronx, and are scarce in more affluent neighborhoods. Those neighborhoods often attempt to exclude special needs populations and because they are affluent, are often able to do so.
“We need to help veterans,” Rivera said. “We need to be equitable. Because of fear, some populations are denied housing. But all people have the right to shelter.”
Community boards 1, 2, 3, 4, 5 and 6 are host to eight or more homeless housing developments each and 67 combined. Community boards 8, 9, 10, 11 and 12 are host to only 12 combined. Community Board 8 – Kingsbridge and Riverdale – has zero homeless housing developments. But CB8 does have four detention centers and 13 nursing homes, more than any other neighborhood.
CB1 – Mott Haven, Melrose and Port Morris – shoulders the most housing developments for people linked to alcoholism or substance abuse. CB12 – Woodlawn, Wakefield, Williamsbridge and Baychester – boasts more foster care housing developments that any other neighborhood.
There are more housing developments for the mentally retarded than for any other population; CB7 – University Heights, Bedford Park and Norwood – has 27, more than any other neighborhood. CB11 – Morris Park, Pelham Parkway, Van Nest, Pelham Gardens and Bronxdale – and CB10 – Co-op City, Pelham Bay and Throggs Neck – aren’t far behind.
Some argue that the uneven distribution is a function of the real estate market: the city and non-profits can best afford housing in poor neighborhoods.
“That argument is unfair,” Rivera said. “In the end, special needs housing [developments] are absorbed by neighborhoods that are already overwhelmed.”
Rather than adopt a “not in my backyard” attitude, Rivera attempts to integrate special needs housing developments, he said. On the one hand, he teaches CB3 residents about special needs populations. On the other hand, Rivera establishes neighborhood advisory boards to monitor the developments. Some non-profit housing developers have repaid CB3 for its help in the form of public recreation space.
Diaz Jr.’s report also maps permanent supportive housing. CB6 – West Farms, Tremont and Belmont – is tops with 26 housing developments for low-income residents, seniors, the mentally ill and others. The report doesn’t appear to include cluster sites, where the city Department of Homeless Services pays non-profits to rent open market apartments for homeless clients.
Reach reporter Daniel Beekman at 718 742-3383 or dbeekman@cnglocal.com