While New Yorkers may be exhausted with the word redistricting after a messy redrawing of the state’s Senate and congessional lines included the courts throwing out the maps passed by the Legislature, leading to a split summer primary, New York City’s 51 City Council districts are next up for its decennial redrawing.
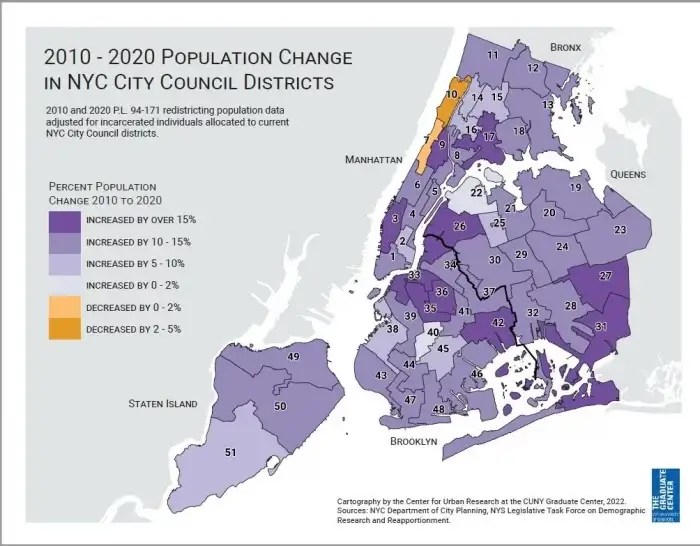
The hope for the eventual end-of-the-year redistricting effort of the council’s district lines — which will set the district boundaries until 2032 — is to, without great backlash, accommodate the city’s census growth of 630,000 people between 2010 and 2020, and accurately reflect large population increases in the city’s Hispanic and Asian communities in the outerboroughs.
The Bronx was one of 10 counties in the nation that saw higher-than-expected growth over the past decade — reaching an all-time high of 1.47 million residents — per recently released 2020 U.S. census data. And much of the Bronx’s 6.3% growth — an addition of 87,546 people to the borough during that period — can be attributed to the large population increases in Morrisania (22%) and Crotona Park East (15%).
As members from the 15-person Districting Commission — seven appointed by Mayor Adams, five appointed by the council’s Democratic majority, and three appointed by the council’s Republican minority — convened at Hostos College on Tuesday, comments and concerns from Bronxites regarding the decennial district redrawing took more than three hours.
But among a sea of citywide concerns expressed at Tuesday’s public hearing is ensuring that redistricting doesn’t disrupt immigrant strongholds that have permeated in the Bronx.
The Bronx is split between nine borough-based districts, with one district — represented by Deputy Speaker Diana Ayala — meshing the Mott Haven, Highbridge, Concourse, Longwood, Port Morris neighborhoods with El Barrio in East Harlem.
The past decade saw the Bronx transform into a predominantly Hispanic borough with 54.8% of the population identifying as such, an increase of 8.8% from 2010. But other ethnic groups such as a bustling Bengali community that created an economic and cultural hub on Parkchester’s Starling Avenue and pockets of Asian immigrants in other Bronx sections has created the need for reflective visibility in the new maps.
Councilmember Amanda Farías, whose district consists of Parkchester, Castle Hill Clason Point and Soundview, argued to keep Castle Hill and Soundview within the confines of the 18th District, arguing for the creation of strong Puerto Rican and Bengali communities in those areas as well as how each of those communities persisted through climate challenges and exoduses of nonwhite Hispanics in recent years.
“The way these communities have come together to combat disparities and challenges shows why its necessary to keep both of these communities in the confines of District 18,” said Farías, who will likely seek a second term in office next year. “These communities have created cultural hubs that serve their fellow immigrant neighbors … that needs to be reflected in the new maps.”
Over the last decade, Parkchester saw a 130% increase in its Asian population, reflecting a boroughwide increase of Asian communities at a 43.2% clip. The largest increase of the Hispanic population in the borough, which increased by 65,050 individuals, was notable in Riverdale-Spuyten Duyvil (+59%), Pelham Bay-Country Club-City Island (+50%) and Morris Park (+38%), Census data shows.
The Bronx’s Black populace, which mimics much of the Black population citywide, decreased over the decade. While Black Bronxites mark the second-highest representation in the borough at around 45%, Norwood and University Heights-Fordham saw a 11% decline.
One of the consequences of this summer’s arduous statewide redistricting process was a shuffling of voter precincts, leaving many voters unaware of the change in their district until June 28 — the date of some statewide and local primaries. Additionally, older residents have taken exception with voting precinct changes that turn small walks to nearby polls into onerous commutes to new voting locations.
“One of the things I don’t like because of redistricting is now I’m not able to vote directly across the street from where I live,” said Andrea McCloud, a Soundview resident. “I’m thinking about the senior citizens in my building, who are certainly not pleased that they have to walk all the way over to (Justice Sonia Sotomayor Community Center) to cast a vote.”
Redistricting experts project an average increase of about 12,333 residents for each Council district, and the commission will need to produce a preliminary map by the end of 2022 thanks to a change in the state’s political calendar two years ago, which shifted party primary elections to June and a charter amendment that changed the redistricting procedure.
The commission must draw districts with populations between 166,000 and 178,000, and under the one-person, one-vote doctrine of the U.S. Constitution, the 51 City Council maps must be redrawn with a new average population of 173,631 residents per City Council district.
And redistricting must be prioritized by population equity; fair representation of racial minority groups; ensuring neighborhoods and communities are kept intact; ensuring that each district is “compact and shall be no more than twice as long as it is wide.”
Districts cannot cross borough or county boundaries; cannot be drawn to separate concentrations of voters enrolled in the same party; and must ensure the districting plan “minimizes the sum of the length of the boundaries of all of the districts included in the plan.”
New maps must be certified by next February, ahead of the City Council primaries in June 2023.
Population counts by section, according to the 2020 census:
Soundview/Bruckner/Bronx River – 74,342
Concourse-Concourse Village — 69,387
Mott Haven- Port Morris – 57,718
Bedford Park – 55,521
Eastchester/Edenwald/Baychester – 51,736
Mount Eden-Claremont (West) – 49,651
Throgs Neck/Schuylerville – 48,116
Riverdale/Spuyten Duvyil – 47,927
Wakefield/Woodlawn – 47,657
University Heights (North)/Fordham – 46,538
Norwood – 43,466
Melrose – 42,651
Castle Hill/Unionport – 41,420
Longwood – 40,289
Morrisania – 37,607
Co-op City – 37,369
Soundview/Clason Point – 37,297
Kingsbridge Heights-Van Cortlandt Village – 35,777
Belmont – 35,825
Allerton – 34,623
Parkchester – 33,602
Pelham Parkway/Van Nest – 32,425
Highbridge – 32,456
Tremont – 32,150
Crotona Park East – 30,158
Pelham Bay/Country Club/City Island – 29,462
Morris Park – 25,077
Claremont Village/Claremont (East) – 24,553
Kingsbridge-Marble Hill – 22,807
West Farms – 20,147
Westchester Square – 17,376
Hunts Point – 15,131
Anyone wishing to submit testimony on the council maps can write to the commission at publictestimony@redistricting.nyc.gov.
Reach Robbie Sequeira at rsequeira@schnepsmedia.com or (718) 260-4599. For more coverage, follow us on Twitter, Facebook and Instagram @bronxtimes